ODI Presentation • Work Week in Review
📄 Download the presentation (PDF document, ~1.1MB)
🗣 Jump to the ODI feedbacks
📦 Jump to the project outputs
Thanks for attending this presentation. We will walk you through our work since we started the project in October, up until this end of the month (Jan 2018). We will conclude the presentation with a new direction we are more comfortable with.
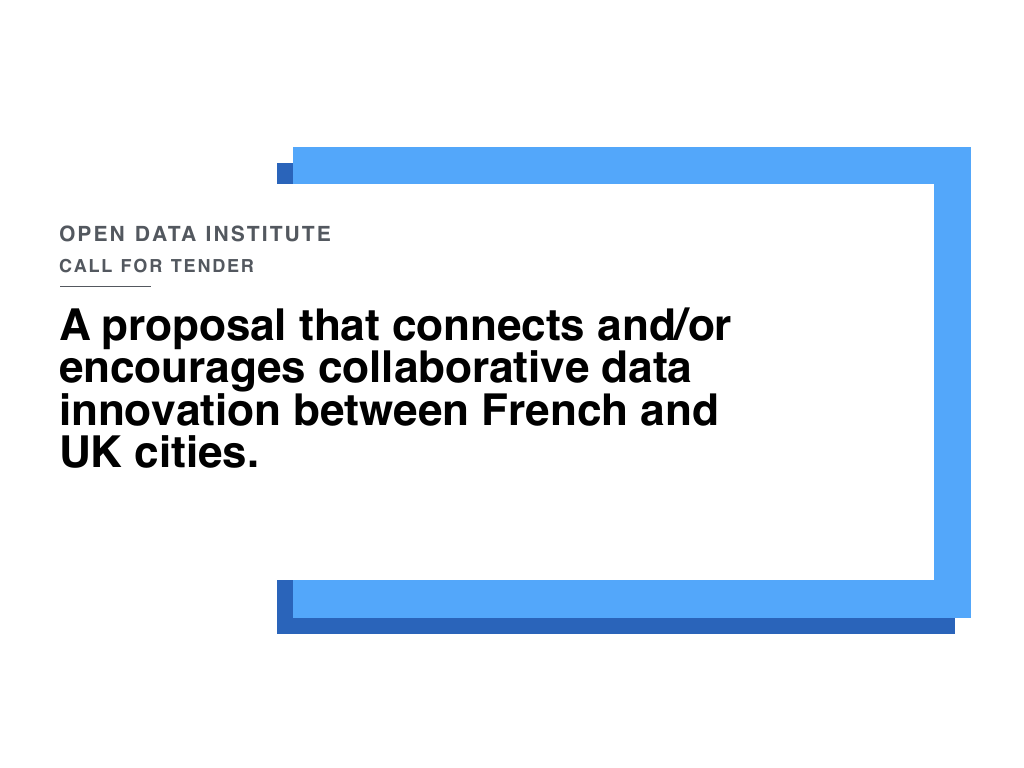
The initial proposal of the project takes part in a strand of work of the ODI which is geared towards connecting and/or encouraging collaborative data innovation between french and british cities.
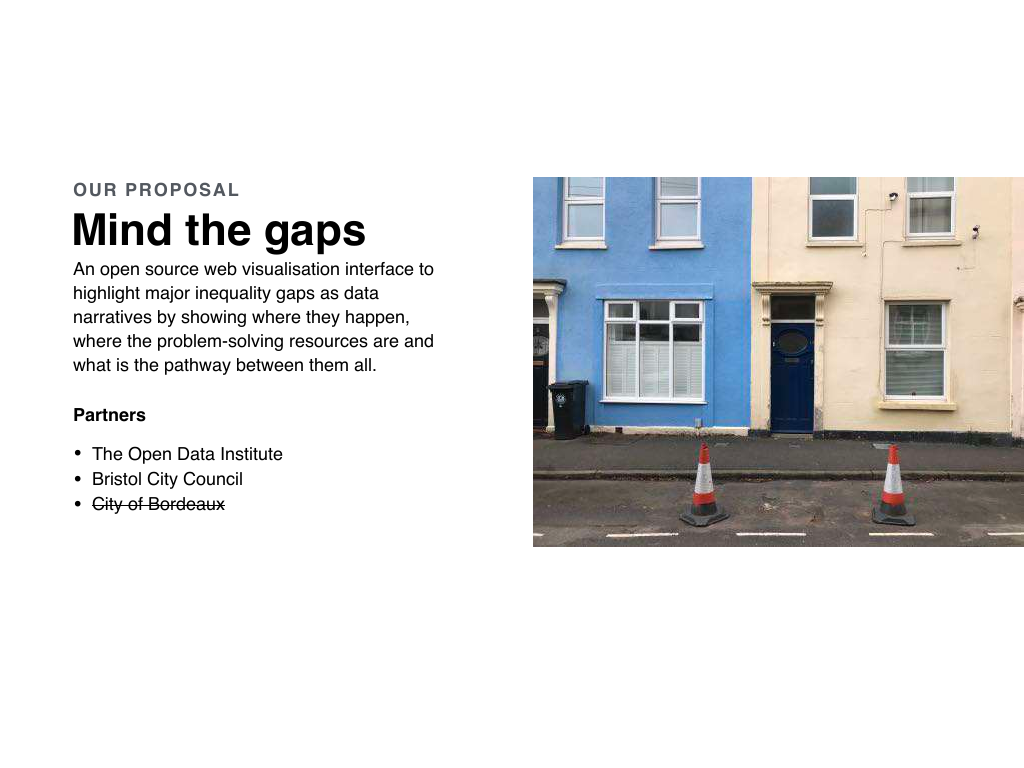
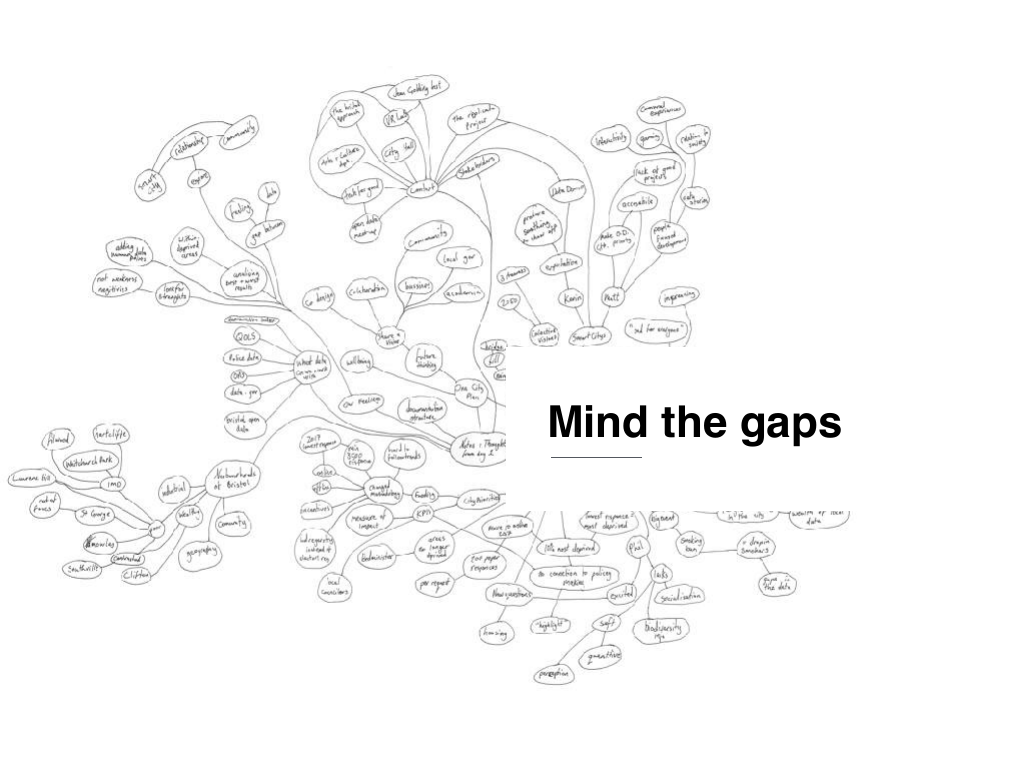
We envisioned this project with the help of the City of Bristol. We thought of a datavisualisation which highlight major inequalities alongside problem-solving resources and the pathways between them all.
We asked Bordeaux to take part to this project. They eventually declined our proposal. Which is fine.
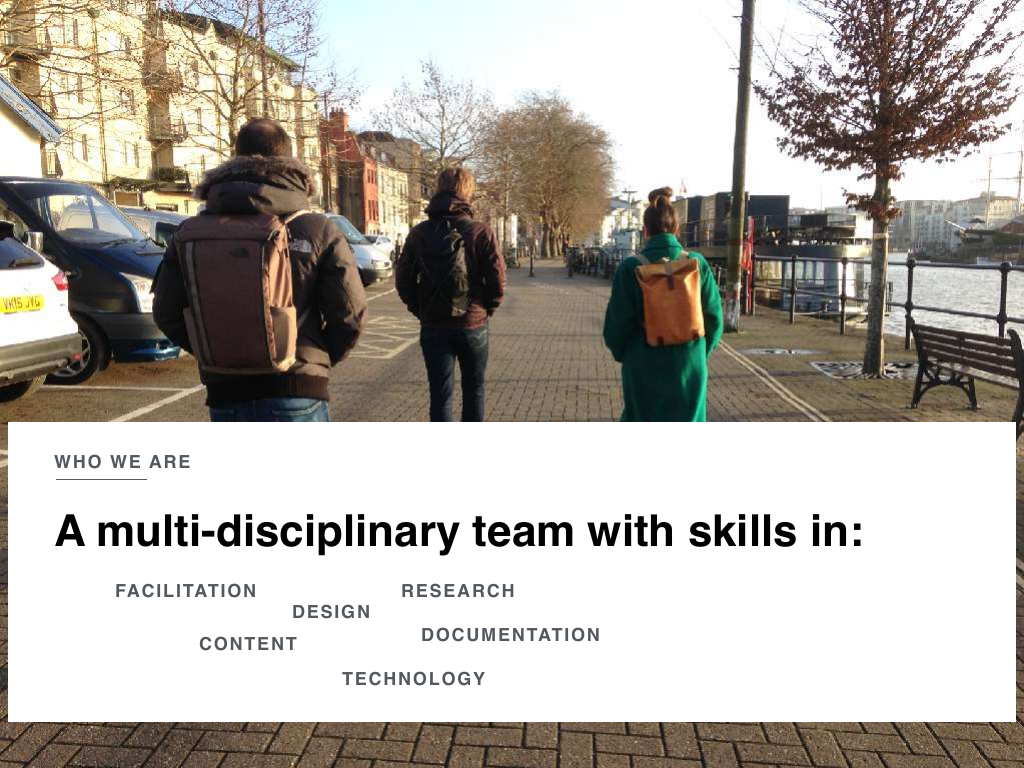
We worked on this project as a data collective with a multidisciplinary approach. We have designers, researchers, facilitators and developers on board.
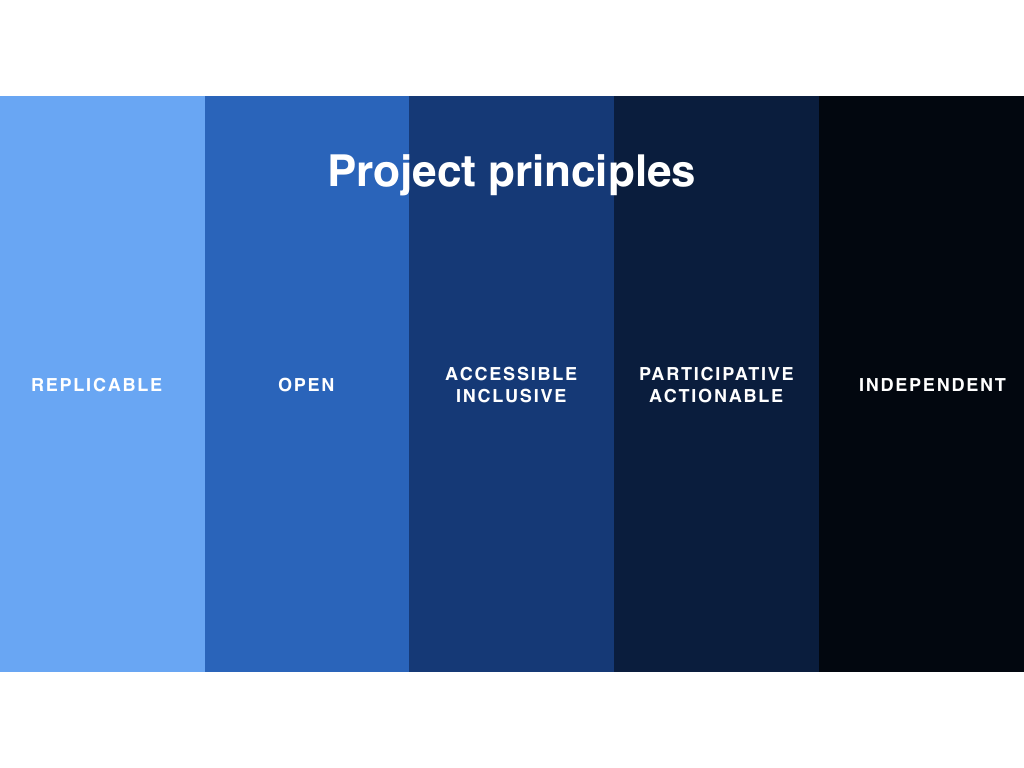
We started the project with the following principles in mind:
- Replicable: it has to work in any city, this can’t be specific to the ones we work with
- Open: open source, open data, open documentation
- Accessible and inclusive: we design with online and offline in mind, with a diverse approach of lifestyles and life conditions
- Participative and actionable: we want to design something engaging, based on a user-centred approach which can be effectively used
- Independant: although we work with stakeholders, we care about keeping a balance between their needs and citizen needs
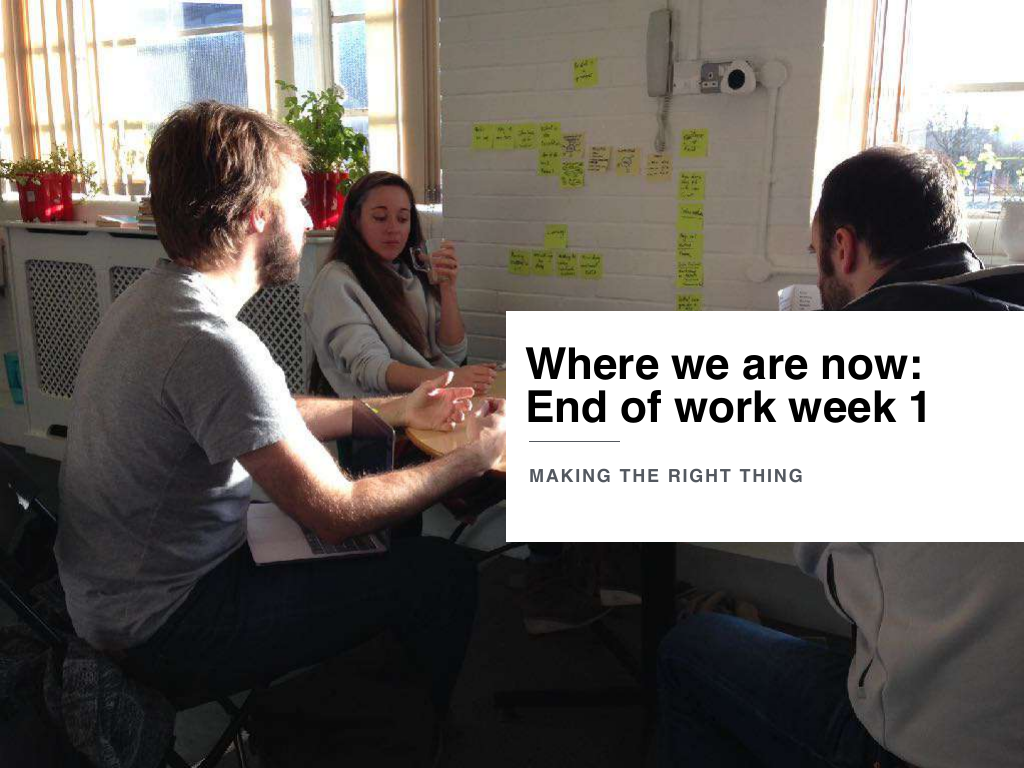
We spent an immersive week in Bristol to make sure we were thinking and designing the right thing.
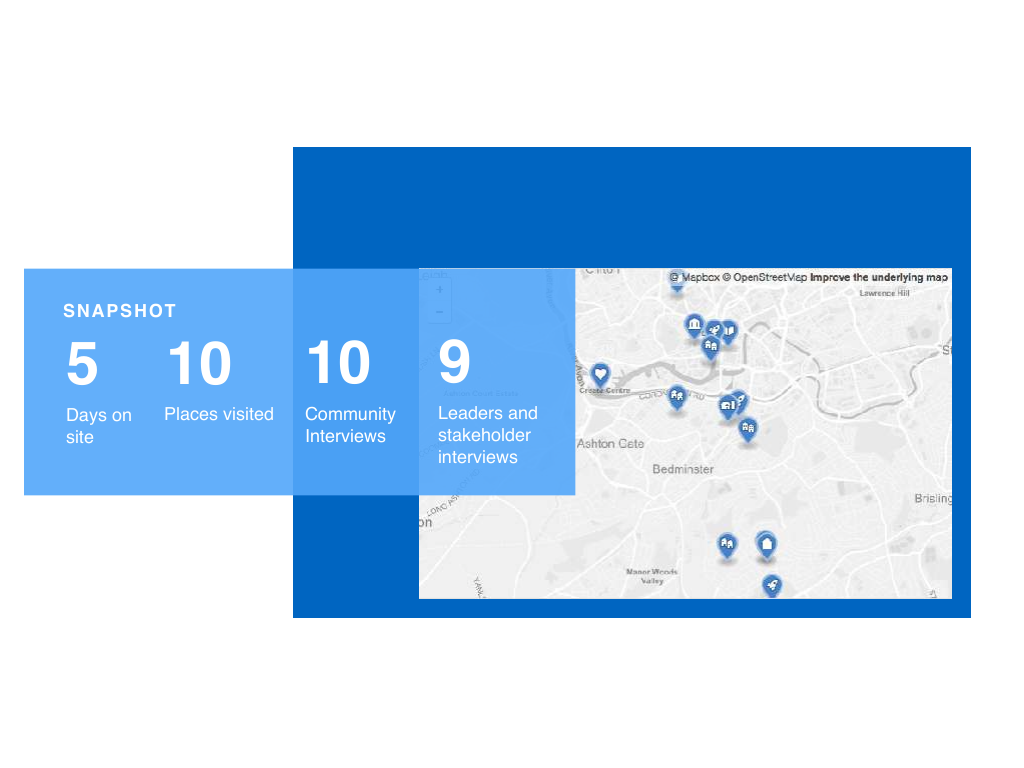
It translates into:
- 5 days living on site
- 10 different places visited
- 10 community interviews
- 9 leaders and stakeholders interviews
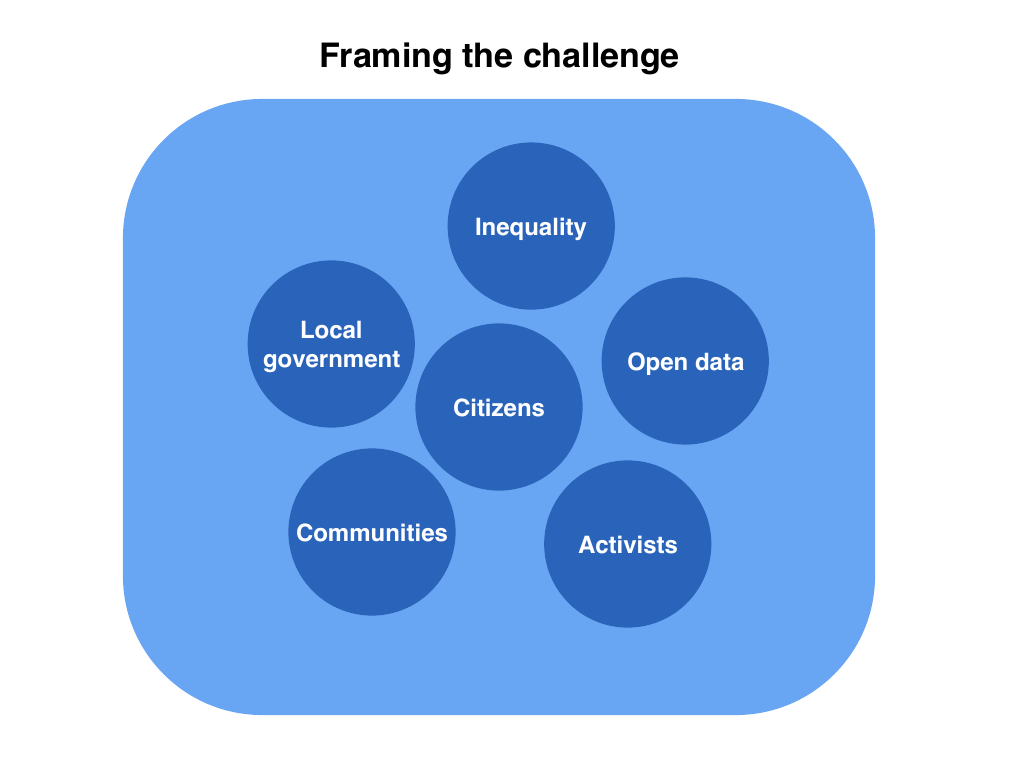
We expanded the vision of the project from local government, inequality and open data. We recently included citizen, communities and activists in our mental landscape.
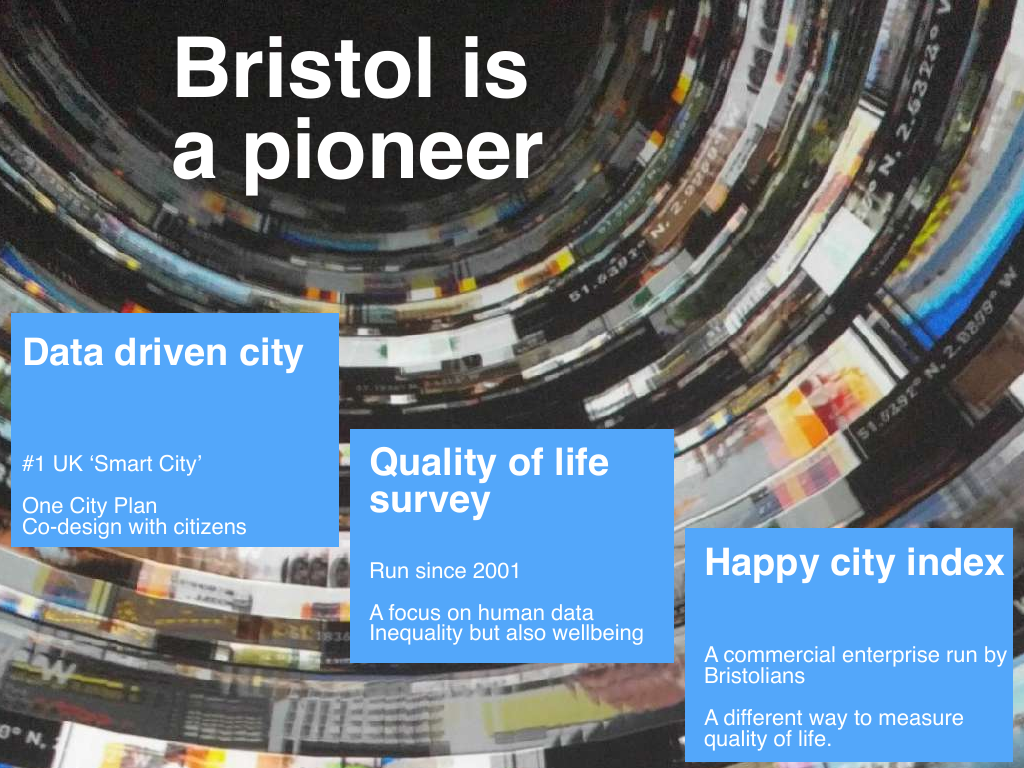
This week in Bristol led us to think Bristol is a leading city.
They are the first UK smart city. This is reinforced with the One City Plan and their will to co-design with citizens.
The Quality of Life survey is unique. It runs since 2001. It focuses on human data, inequality and also wellbeing.
We also discovered the Happy City Index. It is run by Bristolians. They prefer to measure the quality of life rather than satisfaction (QoL approach).
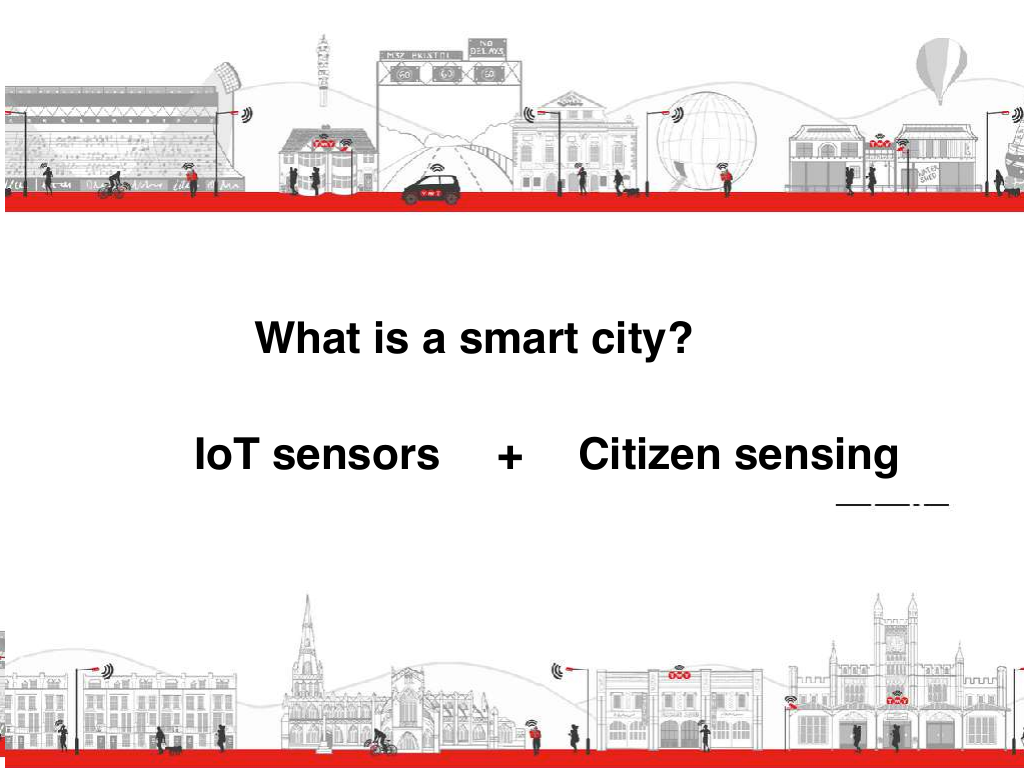
One of our conclusion is a smart city is not only Internet of Things sensors but also citizen sensing. Data generated and produced by citizen-led initiatives.
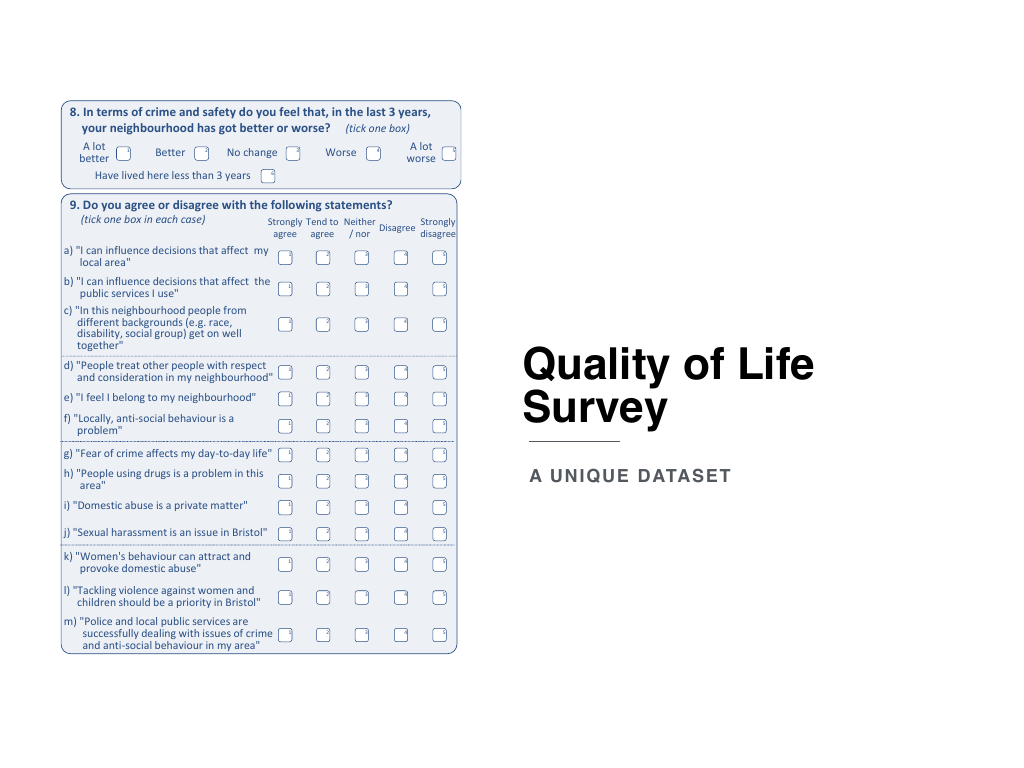
Let’s talk more about the Quality of Life Survey.
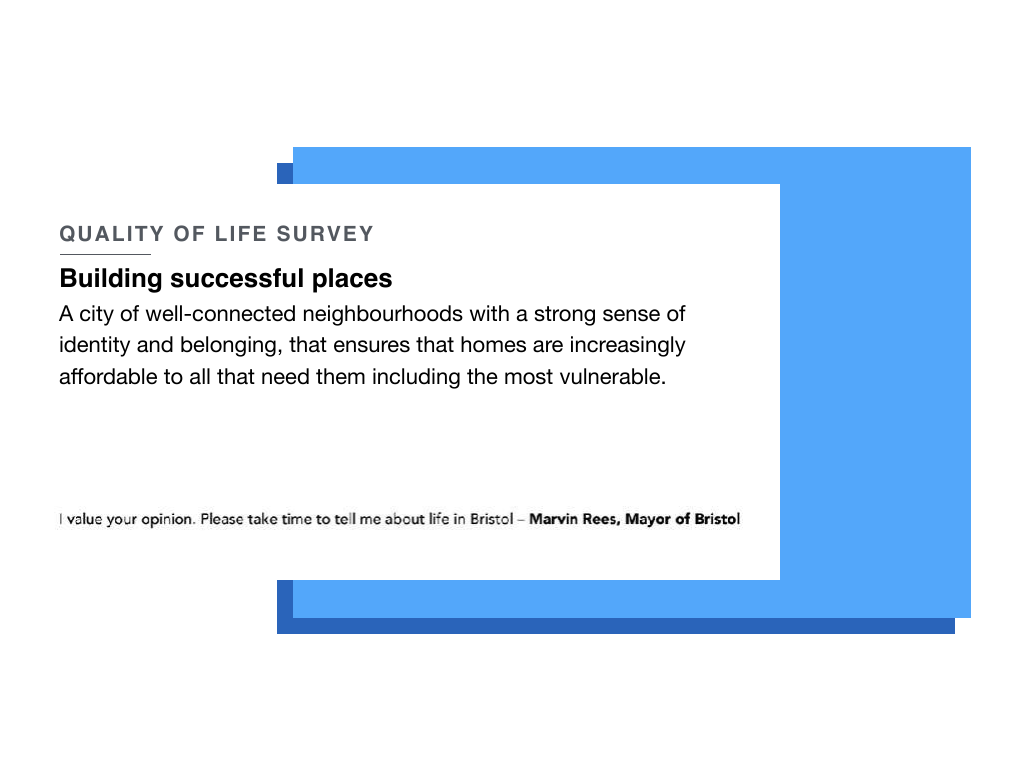
One of the goals of the survey is to help define a city of well-connected neighbourhoods with a strong sense of identity and belonging, that ensures that homes are increasingly affordable to all that them, including the most vulnerable.
We liked the quote of the mayor Martin Rees. The quote can be found on the Quality of Life posting enveloppes:
I value your opinion. Please take time to tell me about life in Bristol.
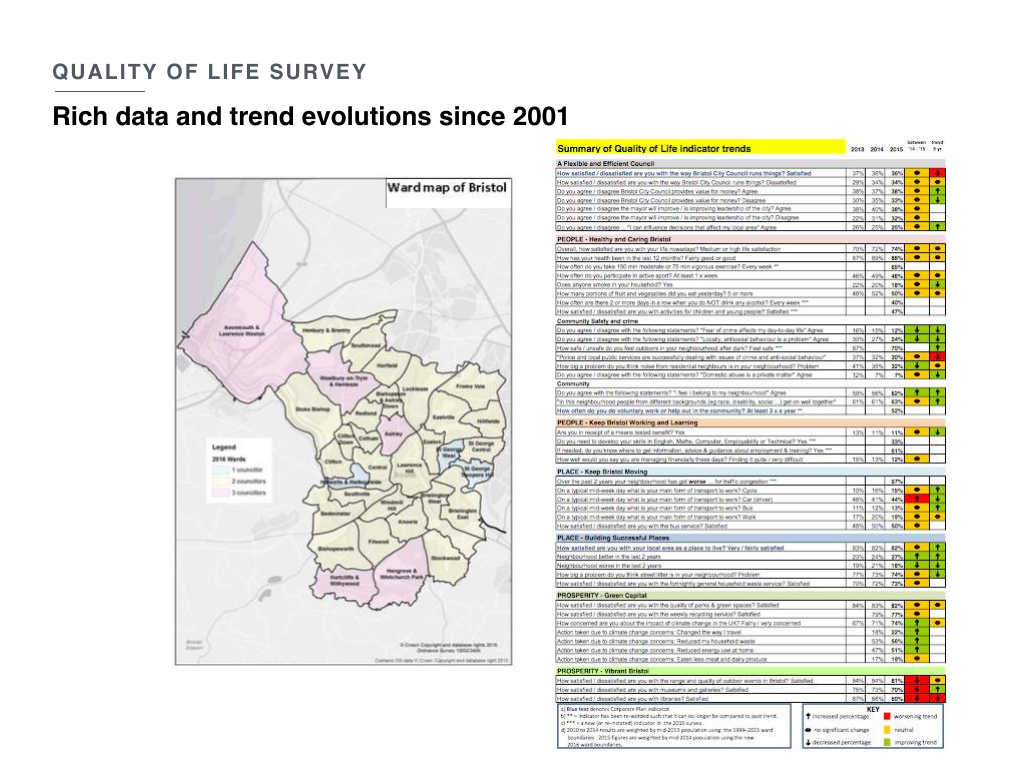
The survey is rich of data and trends evolution since 2001. By ward. By priority indicators.
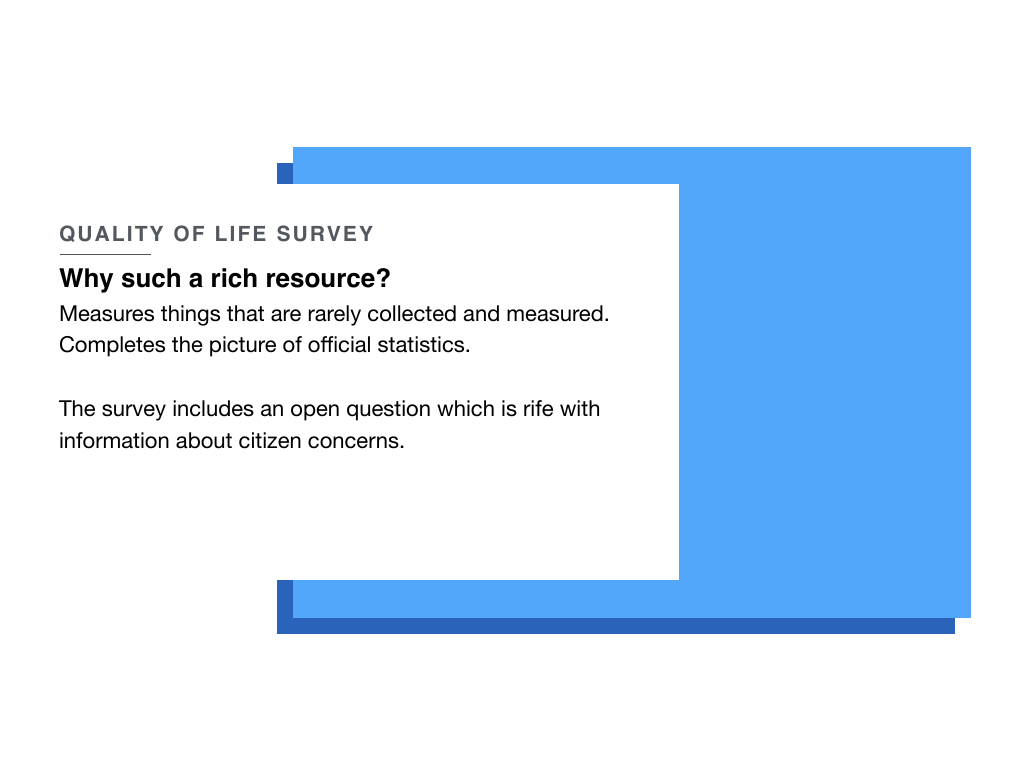
Why do we think it is a rich resource?
We think it is because it measures things which are rarely collected and measured from citizens. The survey completes the picture given by offficial statistics.
The survey also contains a closing question which is rife with information about citizen concerns.
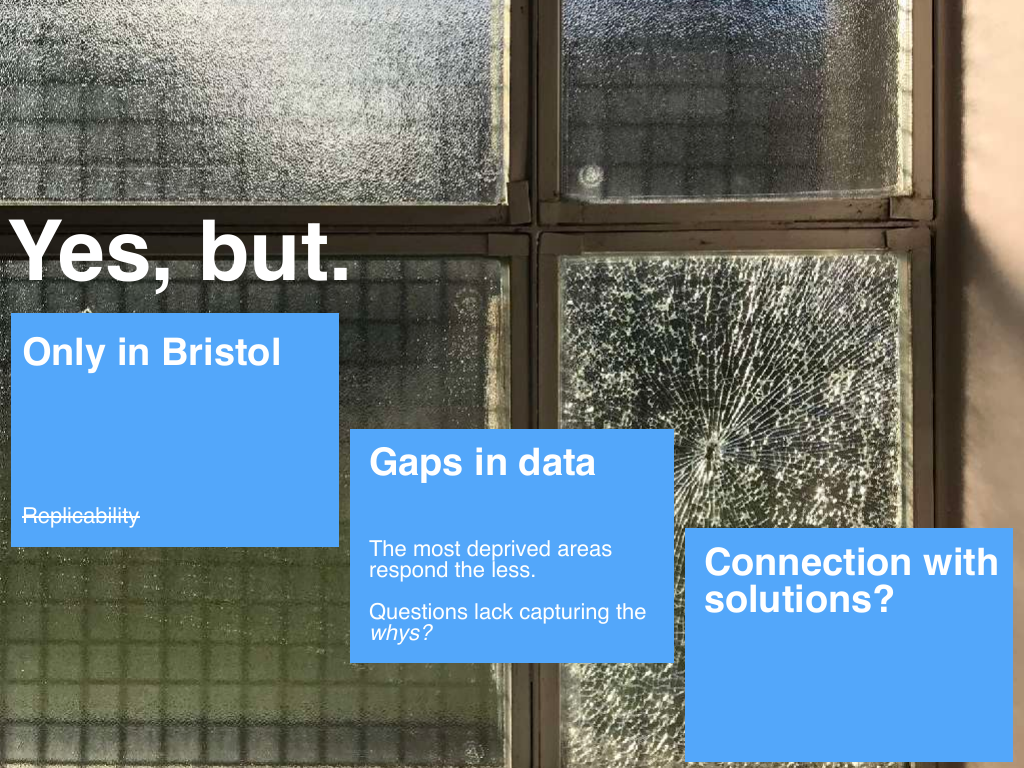
It is a rich resource but it exists only in Bristol. It is then not replicable (cf. our project principles).
There are gaps in data. The most deprived areas respond the less. Some questions lack capturing the whys.
We felt we hit dead ends when a set of questions was highlighting a problem but was lacking connection with solutions.

It made us think wideer than the initial proposal proposal, based on visualisating existing data.
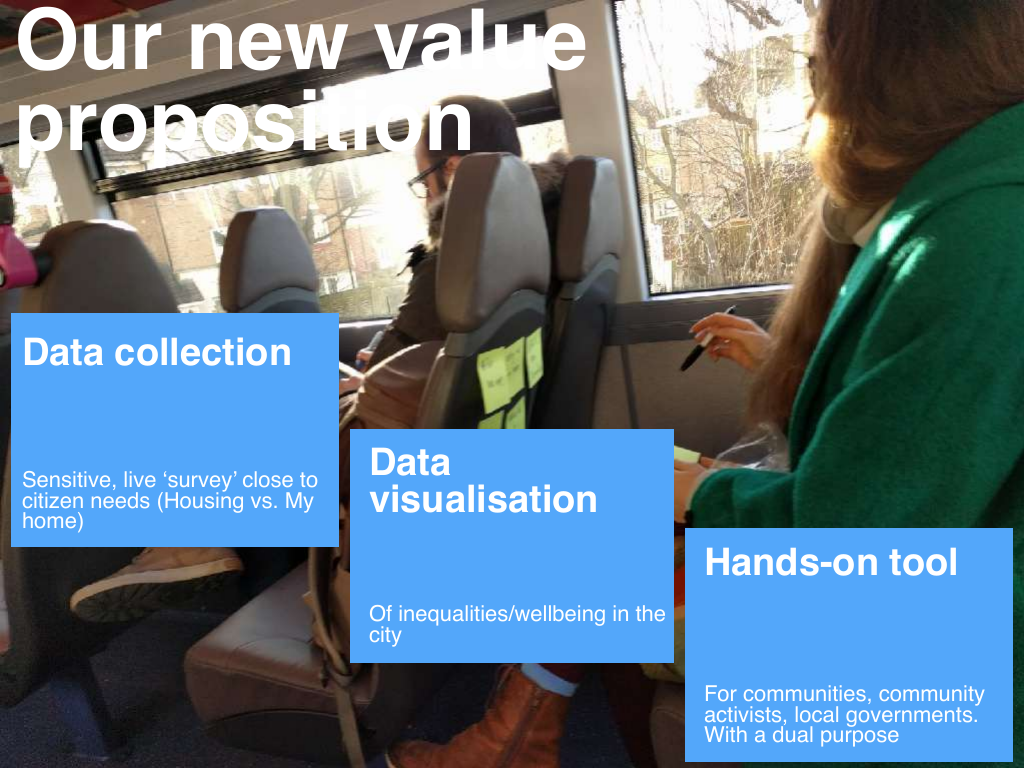
We came out with a new value proposition that goes beyond data visualisation:
- Data collection: on the sensitive side of things, a live survey close to citizen needs, in term of topics but also in term of personality (Housing vs. My home wording kind of things)
- Data visualisation of inequalities and of weelbeing in the city
- Hands-on tool for communities, community activists, local government. With a dual purpose.
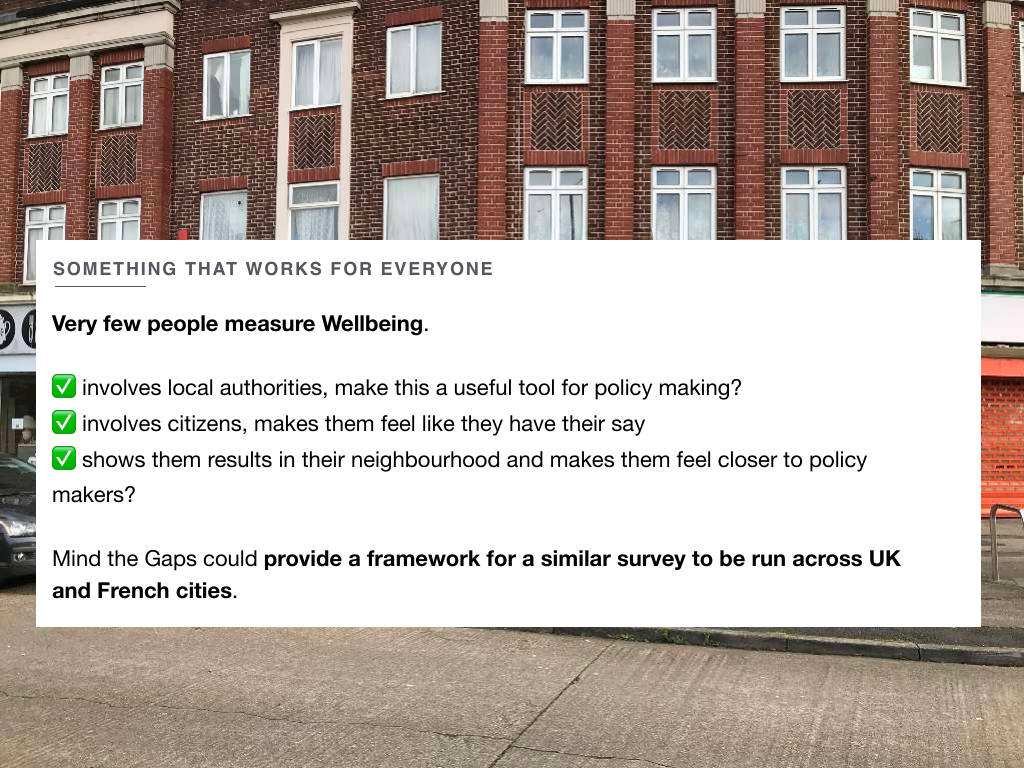
Very few people measure wellbeing in a transparent and accountable way:
- ✅ involves local authorities — make this as a useful tool for policy making?
- ✅ involves citizens — make them feel they have their say?
- ✅ show them results in their neighbourhood and make them feel closer to policy makers
We would like to provide a framework for a similar survey (than the Quality of Life survey) to be run across British and French cities.
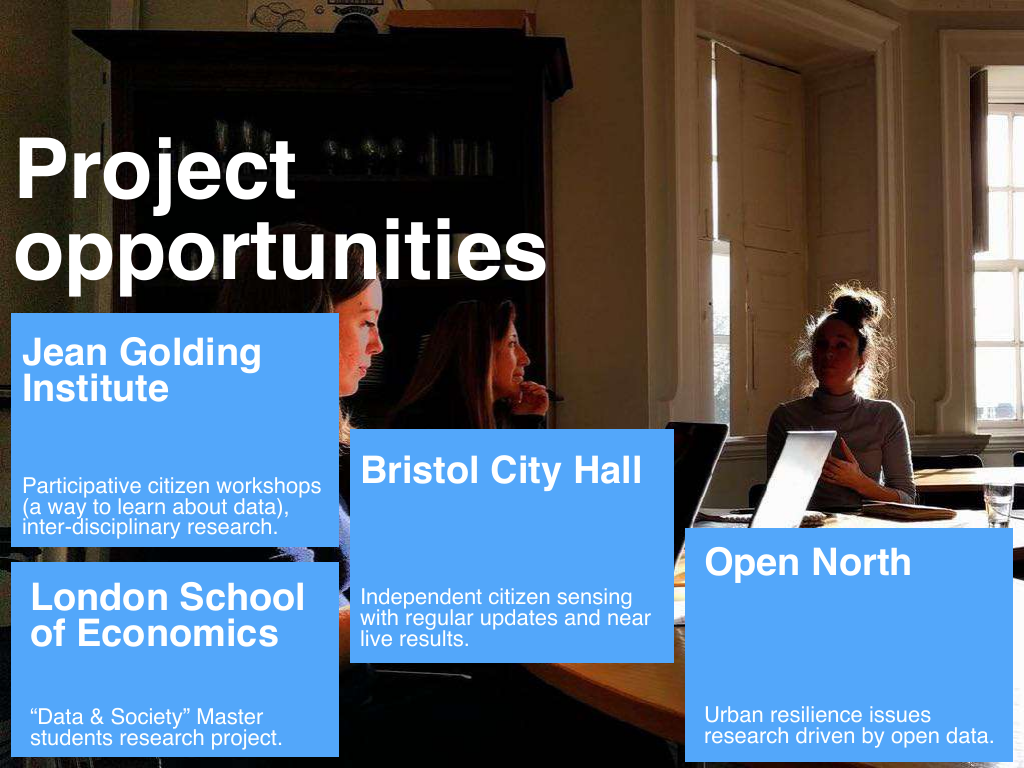
While being on the field, we connected with communities. A few opportunities rose from these interactions:
- Jean Golding Institute: they would be interested in participative citizen workshops, as way to learn about data making through the purpose of having their say
- Bristol City Hall: an independant citizen sensing that feeds directly into their open data platform
- Open North: they are about to research urban resilience issues via innovative open data initiatives
- London School of Economics: via the Data & Society master and PhD researchers
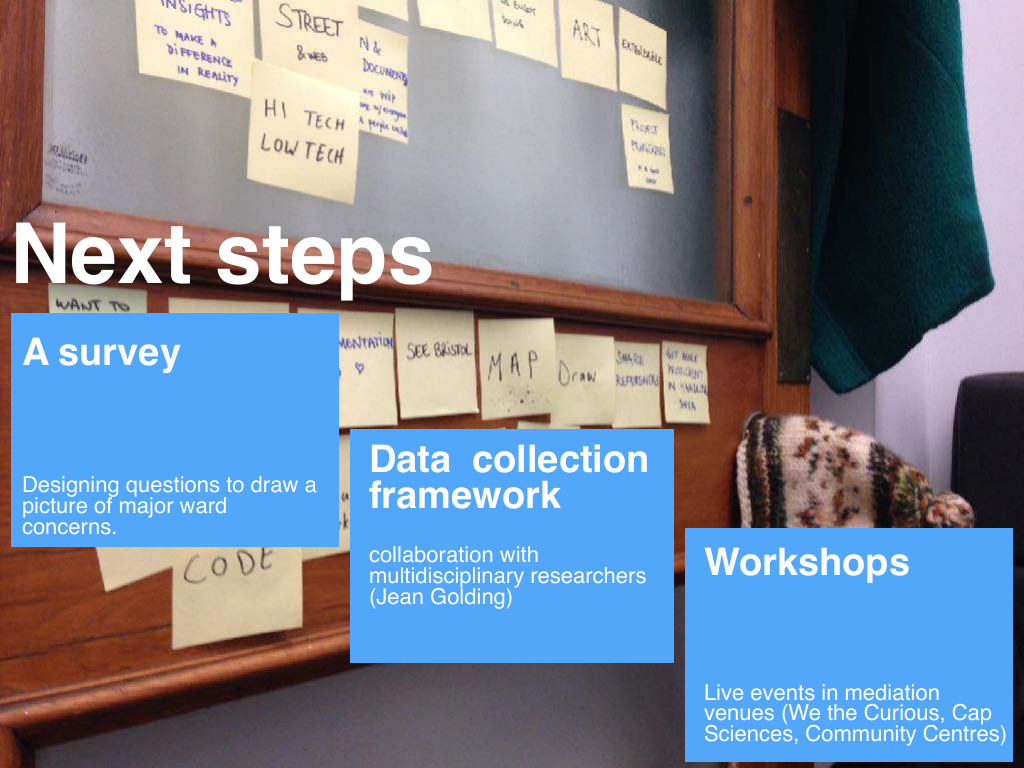
We identified a set of next steps:
- Survey: designing questions to draw a picture of major ward concerns
- Data collection framework: possibly to be extended in a second phase with multidisciplinary researchers at Jean Golding Institute
- Workshops: live events in mediation venues (We the Curious, Cap Sciences, various community centres)
Thank you for your time :-)
ODI feedbacks
- What was particularly exciting in the initial proposition was the highlighting pathways to solutions part of Mind the Gaps.
- Understanding why we shifted away from the previous point; our answer is it is highly dependent on context and therefore non-replicable. The ODI said it is a common endeavor. Mapping why that didn’t go through would be useful.
- Our proposal was interesting and they would like to see it develop: they were particularly keen to understand how this would test in Bordeaux.
- They were curious about what the political sensitivities or potential barriers could be.
Project outputs
At the end of February, Mind the Gaps outputs would be:
- a rich ethnographic research
- a prototype with user research / signal testing
- a reflective report with a clearly outlined research methodology
We’re offering to combine the ethnographic research and the report on the website. We will pursue prototyping and user testing as best we can in the time we have left.
It’s within the realms of possibility that we might only be able to develop a framework/guidelines to continue the citizen sensing prototype.
The report would stick more closely to the grant brief (data innovation projects between French/UK cities).