Diary of day 3 • Watershed and ideation sketching
Program for the day:
- 9.00 External comms - Get in touch with Jean Golding Institute, other people on the ground at KWMC, Tech for good.
- 9.45 Planning for the day
- 10.00 Individual research, deep dive into Quality of Life survey content and other available data sources.
- 12.00 Solidification of our end of day session to surface project ideas and align.
- 13.00 Lunch with Victoria Tillotson from the Pervasive Media Studio.
- 14.30 Ideation sketches round 1
- 15.30 Ideation sketches round 2
- 16.30 Refine project hypotheses
- 17.45 Make dinner, bake bread, buy chocolate.
- 20.00 Documentation
- 21.30 Retrospective
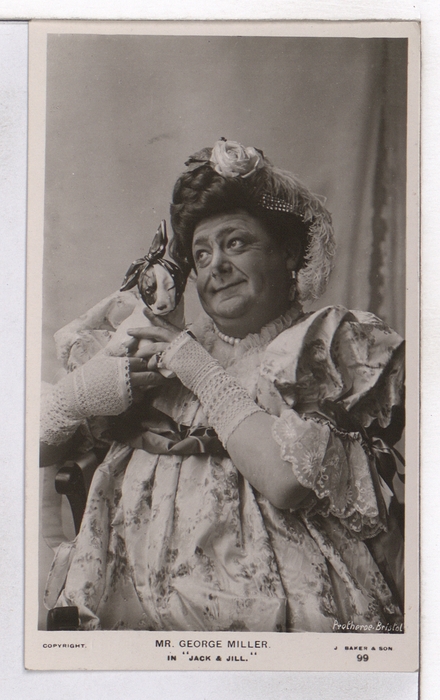
Image of the day - ‘Theatrical individuals’ in the Bristol archives

At the Open Data Community Meetup the previous day, we witnessed the challenge of compiling data sets that are all made available on different platforms.
We need a clearer picture of the data sets we could in fact use (that have been used in Deprivation indexes for example) to see if we can craft a system of our own.
Quality of life survey and available data workshop:
On the back of the envelope containing the survey:
“I value your opinion. Please take time to tell me about life in Bristol” — Martin Rees
Key points:
- The survey is a great example of the richness of conclusions from data that is sourced locally, and on a more human level than state statistics.
- It has been running since 2001 which makes it a pioneer in data production of this kind.
- It bears similarities with the Happy City Index initiative, which also originated in Bristol.
- To paint a faithful picture, we need to combine data sources, quantitative and qualitative. Our guerilla interviews from the previous day help us draw out major areas of concern.
Can the Quality of Life survey be our main focus / starting point to draw out data stories?
It is a better quality source (more human and more granular in its measure of wellbeing) but doesn’t exist anywhere else in the same form. A major blocker considering our project’s key aim is to be replicable. However, it’s a great source of inspiration and base for the project.
We note that there is a national survey on the cost of living (rent + job income + basic entertainment — beer, cinema ticket) we can also refer to.
What are the main data stories we can tell from this?
The Council has a sheet that outlines Priority Indicators, a way to summarise findings from the survey and highlight certain points. The newly elected mayor has made a focus on reducing inequality in the city.
Council satisfaction/dissatisfaction: 50% appreciation of the City Council. We are surprised to find a question around value for money concerning the Council, specifically. In contrast, people are globally satisfied with their area (76% satisfaction overall and 56% in deprived areas).
Struggle with money: overwhelming results. Noise is also a big complaint.
→ Where are the biggest gaps between deprived and ‘average’ areas?
Better results about education training information in deprived areas. Housing and transport satisfaction.
From the Open Data Community Meetup, other areas of citizen concern emerged:
- Transport and health.
- Water quality / air quality. (Remembering the success of the ‘Damp busters’ developed by the Bristol Approach in which data collection made a tangible difference for citizens). Perhaps connected to quality of life there are sun / UV sensors.
- How can we help build on wellbeing data for cities?
- Compelling example yesterday of the reuse of archive material/images. Would that be a path for us, to enrich the experience? Archives (photographic or otherwise) are also an interesting source of available data to include in the project.
How can we identify other useful data sets?
Find out which are the most viewed or most downloaded data sets in national and EU open data platforms. Added benefit of increasing the likelihood of replicability.
Take cues from the community? Rent/housing, homelessness, anti-social behaviour.
Mind the gaps could be… A framework to create citizen data — potentially part of the One City Plan and/or Open Data Activity Programme?
Concluding remark:
IoT or human sensors? The question of hot and cold data re-surfaces.
Project principles:
•    Independent
•    Replicable
•    Accessible: easily understandable, inclusive for disabled audiences.
•    Participative/actionable
•    Open
Lunch with Victoria Tillotson
Creative producer at the Pervasive Media Studio. Part of our ‘Community leaders interview list’, she is the lead on Watershed’s annual Residency programmes, she delivers creative labs, supports individuals through professional and project mentoring. Victoria has a background in visual art and participatory projects.
Afternoon
We stick around after a delicious lunch at the Watershed for some ideation sketching.
The project is getting clearer in everyone’s minds, but we might still approach it from different angles. Which good things can we take from each to place them in the same salad bowl?

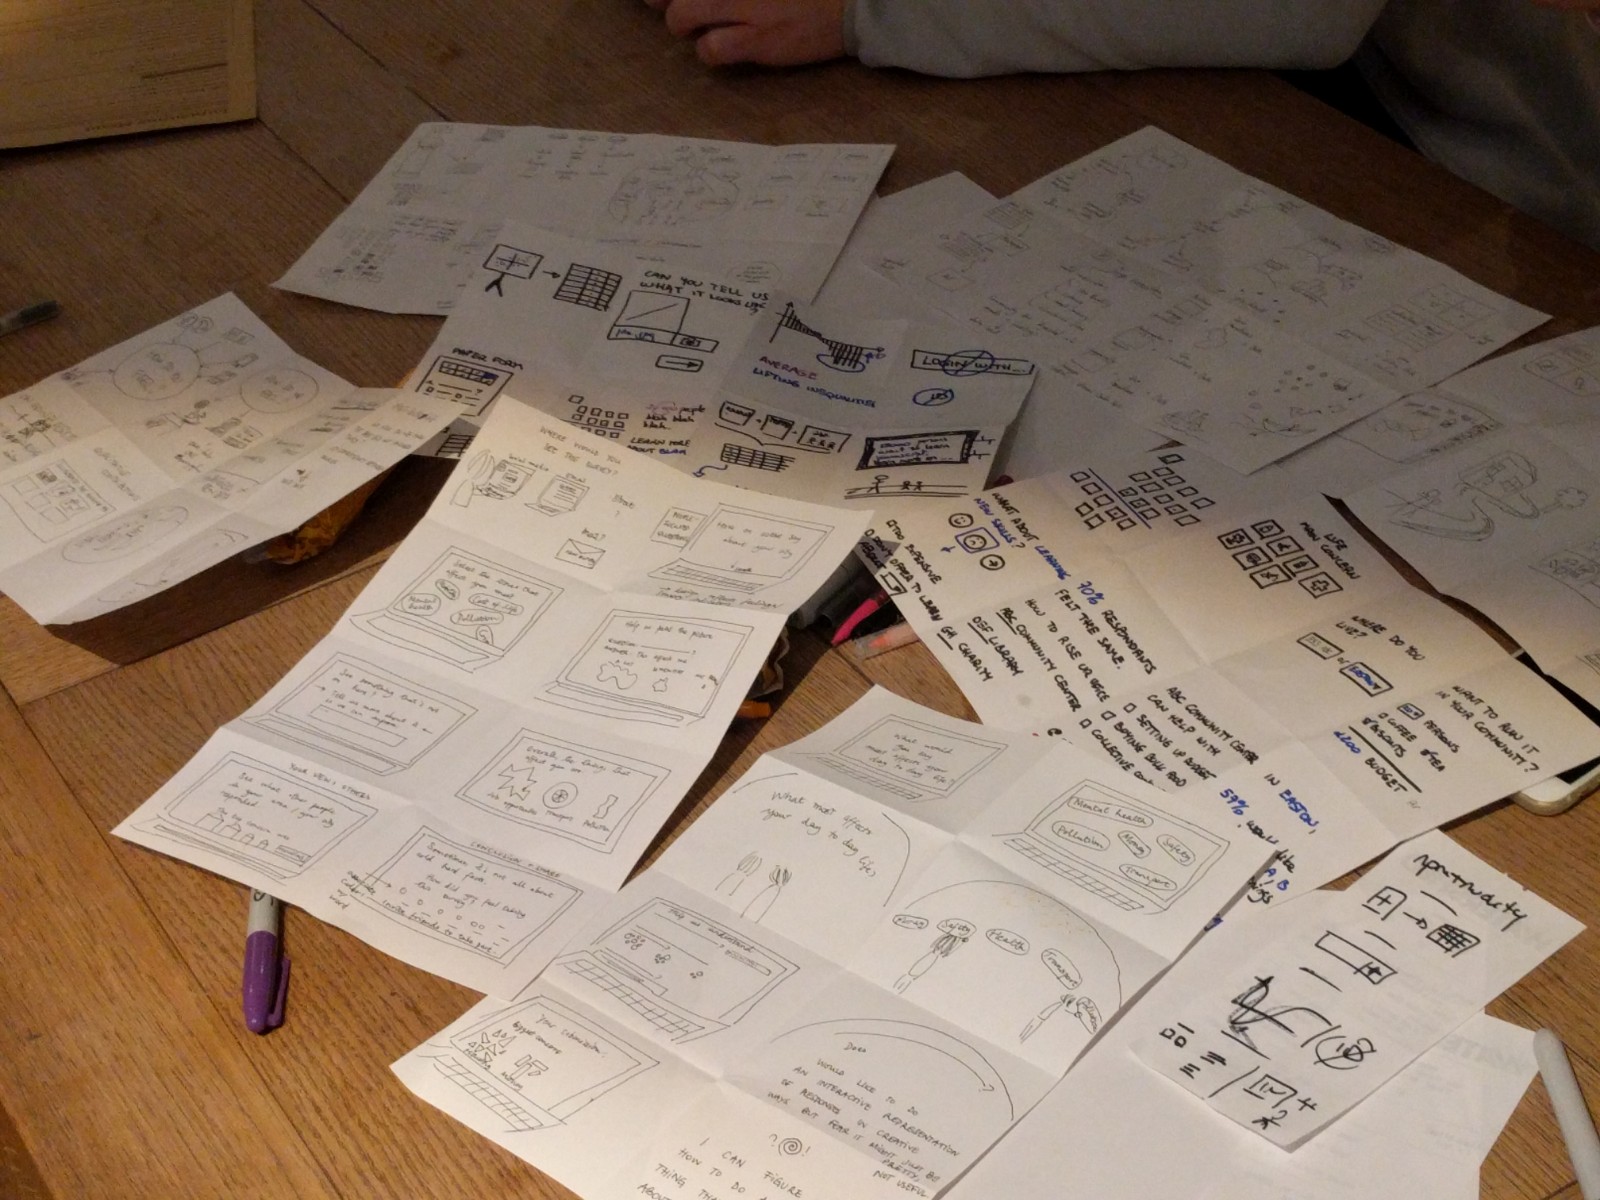
See the result of our 2-minute-per-sketch rounds.
We make roast vegetables & halloumi for dinner, and take the time to retrospect.